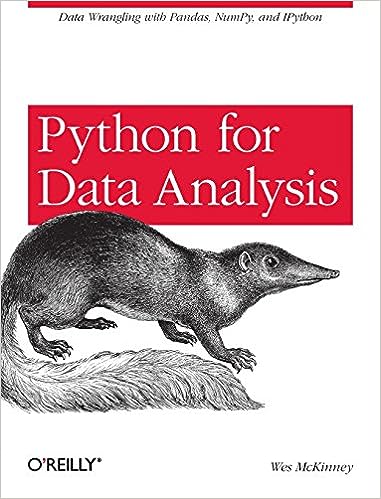
The book "Python for Data Analysis" is mainly focused on using libraries like Pandas and NumPy. It covers a wide range of topics, including data cleaning, transformation, plotting, visualization, time series, and modeling. I personally use it on my iPad, as it allows me to easily copy and paste code and follow web links. While I've previously learned from online resources and Stack Overflow, this book offers a clear and organized reference that complements Python courses. The 13 chapters provide a good understanding of basic Python setup, data structures, syntax, and more advanced data analysis techniques. It doesn't delve into topics like parallelization or object-oriented programming, but overall, I would rate it highly for its depth, readability, and practicality.
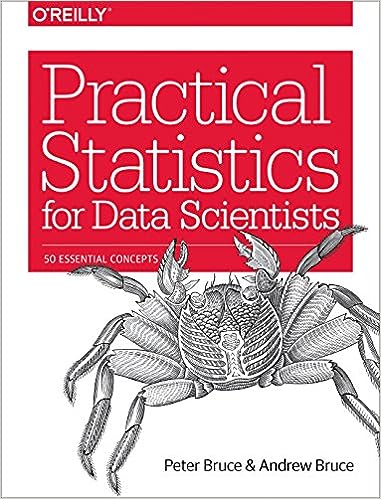
Practical Statistics for Data Scientists is an incredibly useful and beginner-friendly book that covers essential concepts for data science. It delves into key areas like descriptive statistics, sampling distributions, hypothesis testing, A/B testing, and prediction, even touching on unsupervised learning. I drew a lot of inspiration from its first two chapters for one of my earlier videos on statistics for data analysis. The book presents each statistical concept in bite-sized sections, making it approachable and concise. I love how they provide key ideas and terms you need to know, along with code snippets in both R and Python. This hands-on approach helps you connect theory with real-world application, and you can easily experiment with the provided code.
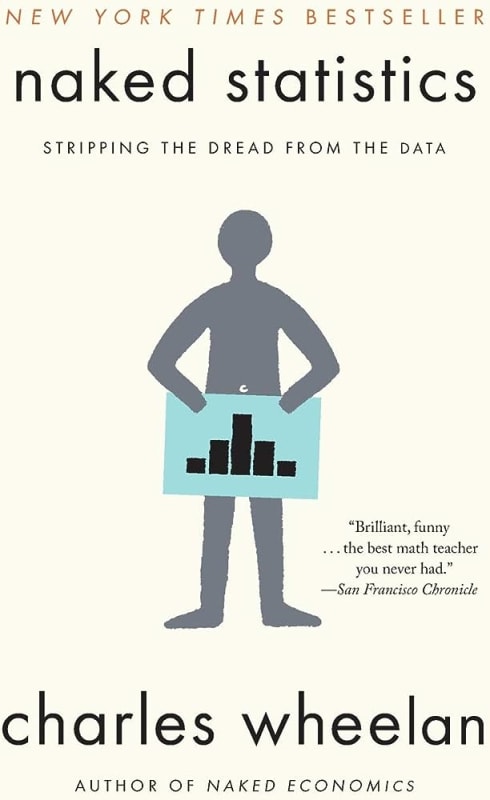
Naked Statistics takes the complexity out of statistics and presents it in an easily understandable way, even for those without a strong background. The author explores crucial concepts like probability, inference, correlation, and regression analysis, demonstrating their applications in various aspects of life, from sports to politics and business. The book is keen on highlighting common statistical mistakes we often make, ranging from minor to major ones in modeling.
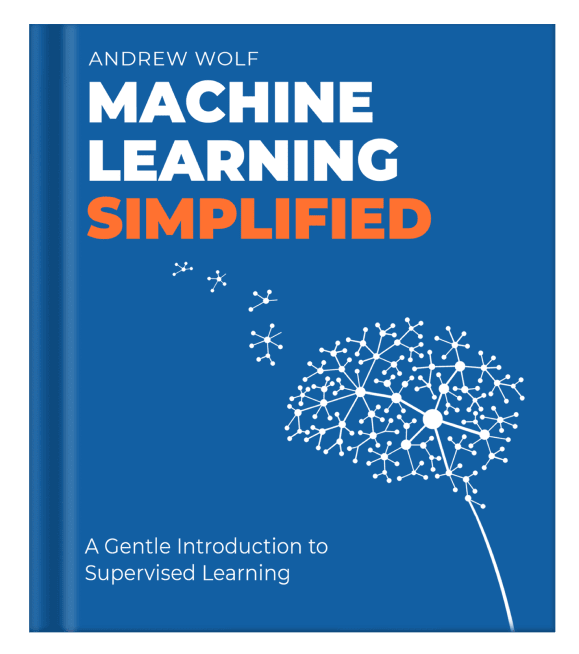
"Machine Learning Simplified" is a recently published book that delves into the fundamentals of machine learning. I find it particularly impressive how it manages to cover a wide range of topics while keeping them accessible and easy to understand. The initial chapters are available for free on a website, or you can grab the eBook for an incredibly affordable price of just two dollars on Amazon. That's quite a steal!
While the book's second part, focusing on unsupervised learning, is still in the works, the existing content is already noteworthy. It's a fantastic resource for both beginners in data science and those looking for a quick refresher. The book's strength lies in its intuitive examples that explain concepts, rather than drowning you in mathematical formulas. This approach makes it stand out as one of the best introductory machine learning books I've come across.
The icing on the cake is the book's repository, which houses practical Python implementations of all the discussed topics. This hands-on aspect enhances your understanding and helps you put theory into practice. All in all, "Machine Learning Simplified" is a valuable and highly cost-effective resource for anyone venturing into the world of machine learning.
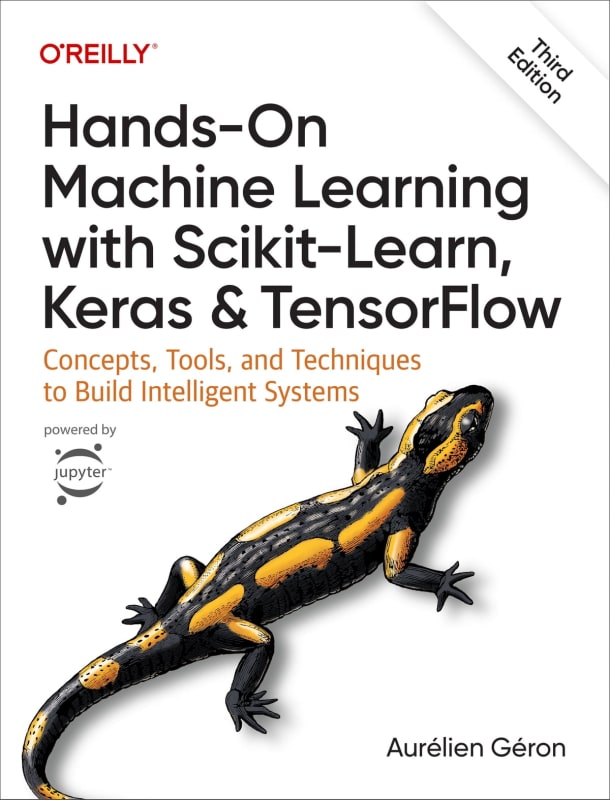
The book commences by offering an overview of various machine learning systems, addressing common challenges, and delving into data transformation and model training. It encompasses a wide array of techniques, terminologies, and metrics required for success. The book's first section also features an array of common supervised machine learning algorithms.
The book effectively delves into crucial aspects of operationalizing machine learning systems. It's well-known that models might excel on toy datasets within notebooks, but translating them to real-world projects presents numerous complexities. Chip Huyen covers a range of critical issues, such as dealing with class imbalances in scenarios like predicting financial fraud, handling limited labeled data for training, and determining the appropriate retraining frequency for models in production.
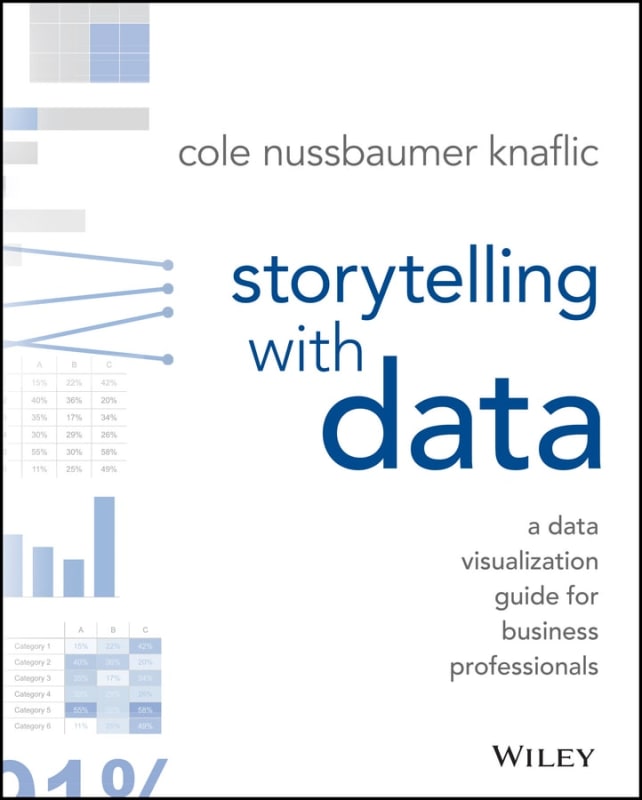
This book is a treasure trove of fundamental principles, offering a plethora of tips and tricks to help you think like a designer and create visuals that truly resonate with your audience. It provides invaluable insights into what works well and what doesn't.
The book guides you in placing yourself in the shoes of your audience, enabling you to catch their attention and convey your story with impact. One of the highlights is the inclusion of five case studies that showcase various ways to enhance visualizations and deliver a compelling narrative.
For anyone engaged in data visualization, this book is a must-read. However, there's a potential for growth in exploring advanced or unconventional forms of visualization that can be equally impactful for storytelling. Another aspect that could be further expanded upon is interaction design, especially since the examples in the book primarily focus on static charts.
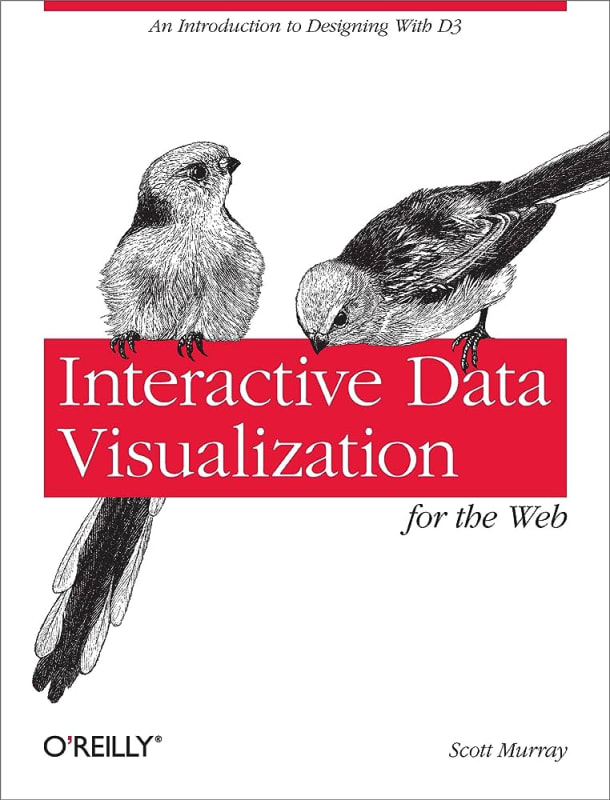
Interactive Data Visualization for the Web is a book centered around the use of the d3.js library for creating dynamic and engaging visualizations on the web. It's a resource that teaches you how to utilize d3.js from the ground up, assuming you have a basic grasp of HTML, CSS, and JavaScript.
The book acknowledges that d3.js can have a steep learning curve, making it more suitable for enthusiasts who are passionate about crafting intricate and visually appealing graphs. While it might not be the most beginner-friendly option, the effort invested in mastering d3.js can result in the creation of complex and captivating visualizations.
The power of interactive and visually stunning data visualizations cannot be underestimated. They have the potential to captivate an audience, enhance storytelling, and create a lasting impression. So, while d3.js might have a learning curve, the payoff in terms of visual impact and storytelling effectiveness can be well worth the effort for those who enjoy creating advanced and aesthetically pleasing graphs.

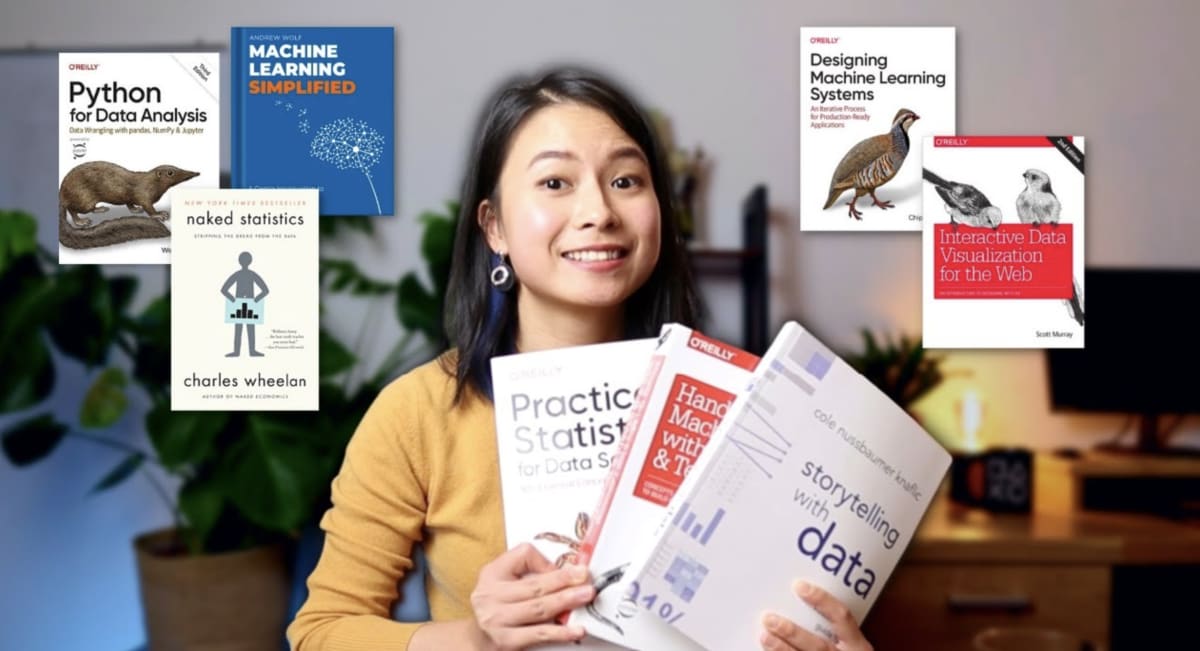
 Python for Data Analysis
 Practical Statistics for Data Scientists
 Naked Statistics
 Machine Learning Simplified
 Hands-On Machine Learning with Scikit-Learn & TensorFlow
 Designing Machine Learning Systems
 Stroytelling with Data
 Interactive Data Visualization for the Web